The Task

Wood Group work across 60 countries and are one of the world’s leading engineering companies operating across energy and materials markets.

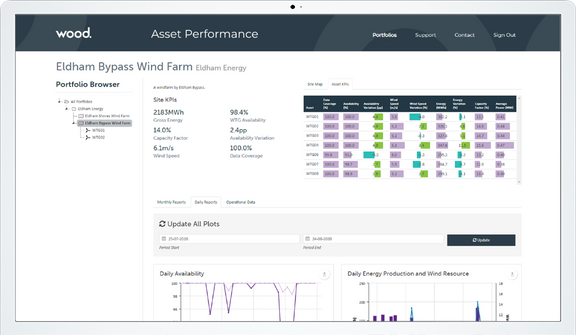
Mucky Puddle was approached to build an ambitious web development project to create a wind asset performance management system. Typically, understanding high-volume complex data across various portals and analysing the data can present numerous challenges. 

The result was a bespoke dashboard to act as a one-stop shop allowing owners, operators and investors to monitor their wind portfolios, analyse and compare data that will highlight improvements to assets. 

Client

Wood Group

Built on

Joomla logo.

Services

Web Development

UX / UI Design

Data and metrics in a notebook.
A windfarm.

System Design

During an initial consultation period, the team focussed on the exact requirements of each subsystem, the required algorithms, database schema design and the types of visualisations needed. Working with the Wood Groups’ data engineering team we created an application to aggregate and manipulate the wind asset data.

An iPad with statistics on the screen.
Two people in front of a whiteboard.

UX Design

The aim of developing the Asset Performance dashboard was to provide a unified data presentation format for wind turbines, regardless of their model or manufacturer. This allows customers to efficiently monitor their entire asset portfolio using a single system, regardless of the turbine brand or location.

Once the backend elements of the system had been built out, the UX team designed a clutter-free visual dashboard allowing users to actively monitor their portfolios. Using interactive charts and graphic widgets we gave the users the ability to take full control of each facet of the dashboard. 

The dashboard allows users to view current and historical data for a single asset, whole project or entire portfolio, including power curves, energy production and capacity factors, availability, asset comparison, downtime categorisation, and event energy yield deficit.

Full system implementation included a PDF report creator,  30+ bespoke information visualisations, and mapping as part of each client’s dashboard.


Related Web Projects

We've picked some projects that we think you might be interested in.
Why not take a look?

HAVE AN IDEA?

Website not cutting it?

We've been helping clients since 2004 and we'd love to help you too! Why not drop us a line?